
Enterprises of all sizes are now grappling with how to achieve insight from data to boost their competitive advantage, capture substantial market share, or carve out a new niche within the market. However, the influx of excessively voluminous data can oftentimes be an untamed beast which presents an additional array of data-driven decisions. Data is dynamic and multifaceted; therefore, reducing time to insight is an imperative.
Data visualization (data viz) is a recurring process throughout the decision-making cycle: it helps to refine and prompt further questioning. For the enterprises that implement a self-service data analytics model, understanding the data process is essential for identifying the underlying insight. The quality of each data viz is largely dependent on the quality of the data architecture itself.
Standard Self-Service Architecture
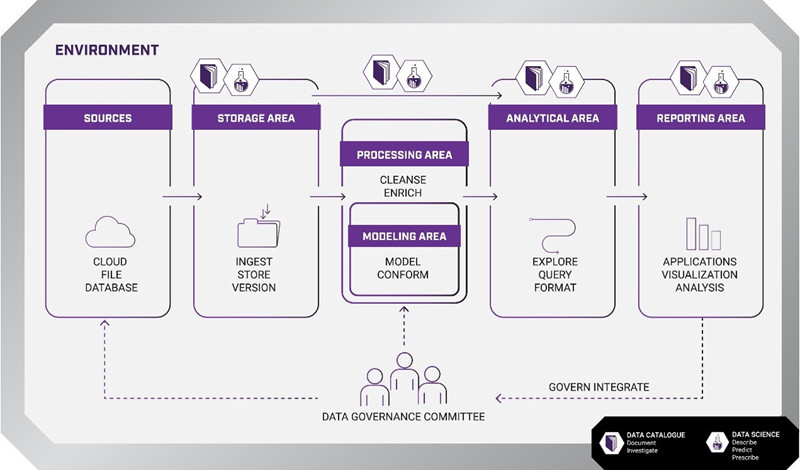
The standardized self-service architecture has five main components embedded within any business environment: data sources, data storage, data processing, data analytics, and data reporting.
Sources
All input channels can be potential data sources: social media, customer service emails, text messages, telephone support, website traffic, customer orders, and so forth. Data flows in from both internal and external pipelines and arrives in structured, semi-structured or unstructured formats. This is also one of the first decision points: Where should the data come from and is it valuable enough to transfer to storage?
Storage
Storage is where the enterprise takes ownership of the data, either through the extraction, transformation, and loading (ETL), or extraction, loading, and transformation (ELT) process. At the loading stage, data is shifted into the database management system of choice, and whether it is cleaned (transformed) before or after storage depends on the nature of the data (real-time, batched, hourly, daily, unstructured, data lakes, data warehouses, etc.) and the capability of the business intelligence tools the enterprise has chosen. Storage presents another decision point predicated on the questions: Which of the data is valuable enough for continued storage? What pipelines are needed for each enterprise stakeholder? Which data storage tools and processes are the best fit scenario for the type of data being collected?
Processing and Modeling
Processing and modeling are closely intertwined analytical components where the data is prettified (cleaned and organized) and the data is conformed to the existing data model which, in turn, is based on the preconceived business model. It would be correct to view this step in the self-service architecture as the application of business rules/logic for data standardization. A few of the questions that arise in relation to this phase include: What governmental or other industry regulations apply to how data is standardized and used within the enterprise? What are the external and internal business intelligence requirements that must be incorporated into the business logic for data modeling? Who will have access to the data and for what purpose?
Analytics
Analytics encompasses two different, but not mutually exclusive, objectives: describe the current data patterns and use predictive or inferential models to help expand understanding as to what the data is likely to mean in relation to the business questions posed and/or to determine a solution to market or internal inefficiencies. Certainly, an exploratory data analysis (EDA) can be initialized to help generate the driving questions, i.e., What is the customer attrition rate and what might be causing it? Where is there a gap in the market sector and how can we fill it? What are competitor solutions and where/how can their weaknesses become our opportunity? Ultimately, the analytics element should be designed with the end user in mind as different departments focus on specific analytical outcomes. Automation of lower-level statistical modeling can help streamline the analytics process.
Reporting
Reporting is the most user-friendly aspect of the architecture as a wider variety of enterprise stakeholders will be utilizing this function. As such, from both a technical and interpretation standpoint, they will need an easily accessible interface which often includes point-and-click dashboards as well as a streamlined process for generating data viz and other reports. Should there be industry regulatory requirements for certain types of reports, then automation of report formatting and content is an optimal implementation. Questions at this final output phase of the architecture are not drastically different than the other architectural stages: Who will be using the reports and for what purpose? What should be included in the reporting? How can the reporting section be the most user friendly while still allowing for advanced functionality? Which reporting and data viz tools (e.g., Power BI, Tableau, etc.) are most aligned with the internal and external reporting requirements?
Data Quality within Self-Service Analytics
While the self-service architecture design and process flow are distinctly linear, there is a repeated pattern of devising and answering questions throughout the process. However, the art and science of piecing together the right question and knowing when to refine the question (or abandon it) isn’t always completely clear. Also, it’s easy to fall into the trap of silo-ing analytical systems where each department is self-compartmentalized due to different stakeholder needs regarding data specifics (e.g., sales, human resources, finance and accounting, etc.). Consequently, the “build first, ask questions later” mantra reinforces reactive rather than proactive decision-making and is the main cause of innovation inhibition.
As has been demonstrated throughout the description of each self-service architecture component, there are a myriad of questions that arise. However, questioning and investigation are iterative processes; like the many-headed monster, once a question is answered, another one materializes. To ensure data quality, two aspects should be added to the self-service architecture: a data catalog and a data governance committee.
Data Catalog
In short, metadata is data about data; it is a dataset that describes and informs the user about other data elements (e.g., timestamps, document summaries, data originator, etc.). It can be viewed in terms of a business-specific “Google” where users can search for a wide variety of data and information housed within the enterprise. Since the data catalog is a central source of truth, it mitigates costly issues such as data or report redundancy, thereby freeing up computational and storage resources (which increases the likelihood of lowering overall data-intensive costs).
Data Governance Committee
The data governance committee is responsible for data management throughout the entire analytic circuit including which data sets will be available to certain users, which reports will be generated, and monitoring the quality of data, analytics processes, and reporting requirements.