
Since 2014, I’ve been a fan of PowerBI, a suite of business analytics tools from Microsoft used to analyze data and share insights. As an early adopter—I was introduced to PowerBI while working with the Enterprise Commerce team at Microsoft so I’ve seen firsthand how the application evolved into an impressive business tool since its infancy.
At Amaxra, we use PowerBI internally and on many of our customer projects to analyze and present data as visually-appealing dashboards. These PowerBI dashboards provide valuable business insights to whoever owns the data. Internally, we set up PowerBI dashboards to show:
- Intelligence on the number of hours we have left on our customer support entitlements. We use Microsoft Dynamics 365 CRM which defines the hours a customer is entitled to receive as a CRM Entitlement. Our PowerBI dashboard can then display how many hours we have left for each entitlement.
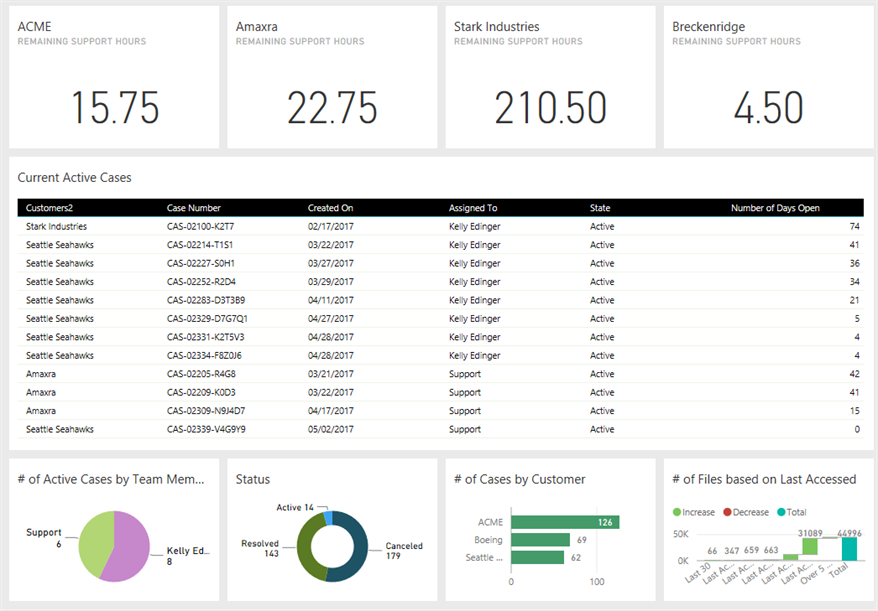
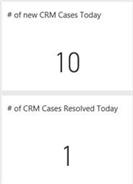
- The total number of support cases (defined as any project, transaction, service or response that is opened and closed over a specific time) reated and resolved. to achieve resolution of a problem, claim, request, proposal, development or other complex activity. Tiles below are created by utilizing the Q&A functionality of PowerBI by creating a simple query.
 c
c
PowerBI dashboards help us stay up-to-date on our customers’ status. It’s powerful information because tracking entitlements and cases involve multiple people, documents, and messages spread across our organizations—all with varying relationships to each other. Best of all, custom PowerBI dashboards like these are surprisingly easy to set up.
Setting Up PowerBI Dashboards Is Simple
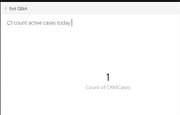
Displaying the number of CRM cases per day and resolved was accomplished by typing in a question into the Q&A field on the Amaxra Dynamics CRM BI dashboard within PowerBI.
In addition, we can create multiple fields of business intelligence to assist in breaking down the number of cases we had in the pipeline. This quickly gives an overview on how busy we were becoming with each customer. It also shows the workload for our team members by displaying who is entering the most cases into the system.
A Caveat About Custom Dashboard Creation
Creating a PowerBI dashboard from a CRM such as Dynamics 365 comes with some challenges. Before you begin to create your custom dashboard, be sure to understand the data contained within your CRM. It can help to create custom columns with unique calculations and be prepared to manage relationships between the different tables to match up the data.
For example, creating managed relationships between two tables to display data from the Contacts table inside the Cases table.
Everyone Wins
In the end, creating this PowerBI dashboard environment helps Amaxra’s business team while giving us a real world “been there done that” example to assist our customers wanting similar dashboards for their business.