
We deal with a lot of information at Amaxra, whether it’s for our own processes or helping our customers. It helps us figure out what needs to be done, when we should do it and who needs to be involved. We use it to create informed strategies for our clients and ourselves. Data is a big deal.
Being able to understand that data is essential, but who wants to stare at a lot of information (such as a massive spreadsheet) for hours trying to figure it out? While Excel can create great visuals and applications like PowerQuery and PowerPoint go a long way for business intelligence, something along the lines of a living infographic is something else and would just make life easier for the greatest number of people.
Just a quick search online should be enough to convince you that people like graphics. Infographics are everywhere, because they communicate loads of information, quickly and easily. You get the point faster and more easily than you would studying a spreadsheet.
If only there was any easy way to turn data into a graphic.
There is! It’s called Microsoft Visio. Visio is the ideal tool for taking complex information and turning it into an easy-to-understand, living, dynamic visual.
Visio works with a data source—like a spreadsheet—and turns your data into a meaningful visual. Now your data is easier to understand. It’s also dynamic, so when you update the underlying data source Visio automatically updates your graphic, keeping your visuals in sync with the data as it changes. So you’re always looking at the most up to date information. On top of that, you can set parameters to have Visio prompt you about important changes, further decreasing your margin of error. This is exactly what you need when you rely on timely information.
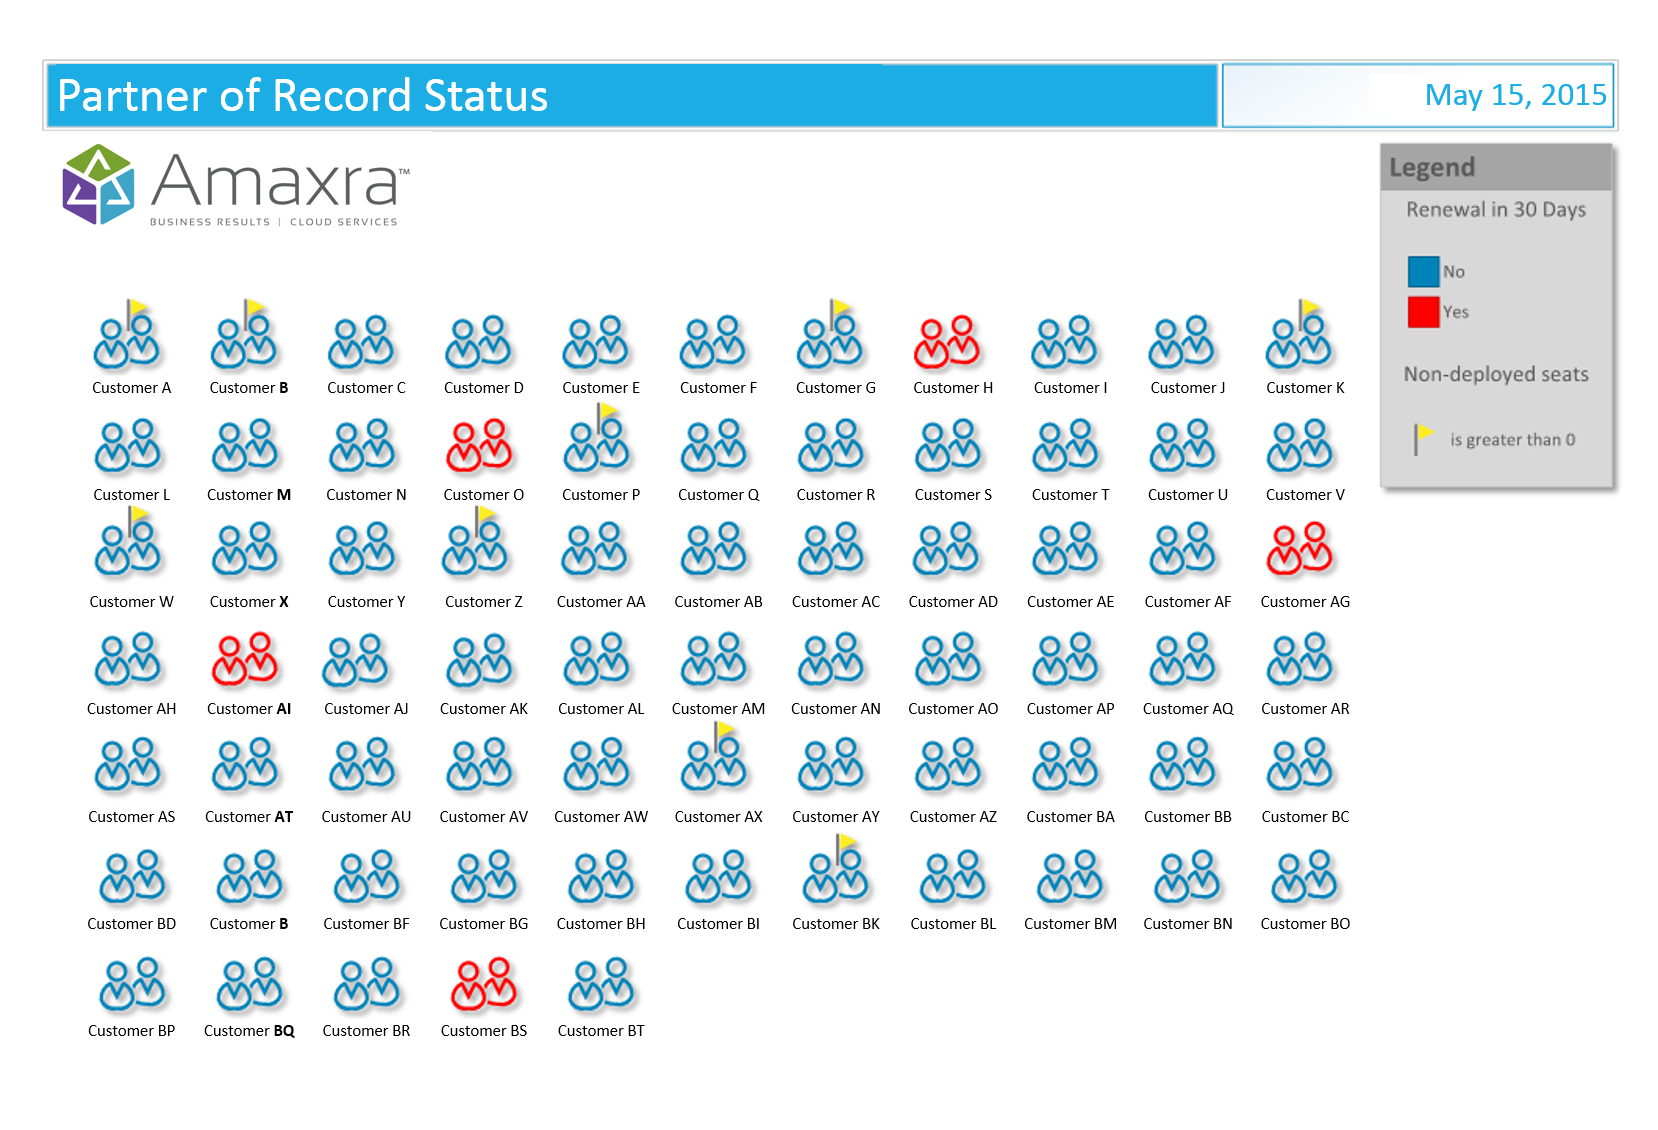
How is Amaxra using Visio? As a Microsoft Gold Cloud Solutions Partner in Office 365, we linked our Office 365 customer portal to Visio and built a graphic. Now, every time a customer’s information changes, Visio automatically updates that graphic. Anybody can look at it and quickly comprehend what actions we can take to serve our customers better as we know how they are utilizing their software investment before we speak with them. And because Visio is dynamic, it can change the colors of infographics or even add flags to reflect any changes we make to its data source. What once required a laborious search for data and manually updating is now readily available to anybody on our team at-a-glance.
 Visio is versatile and different industries use it in a variety of ways. When managers at Virgin Mobile India wanted to find a way to ensure the effectiveness of their call center, they created a visual performance dashboard in Visio that resulted in decreased costs and increased performance. Logistics companies utilize Visio to allow customers to track their deliveries in near real-time. Many companies are able to save time and increase the speed of their operations because employees are able to learn and understand processes with clarity thanks to Visio.
There’s no end to the possibilities. Whatever data you’re already collecting, Visio can make it more meaningful.
Want to know how Visio and other cloud-based tools can change the way you do business?